

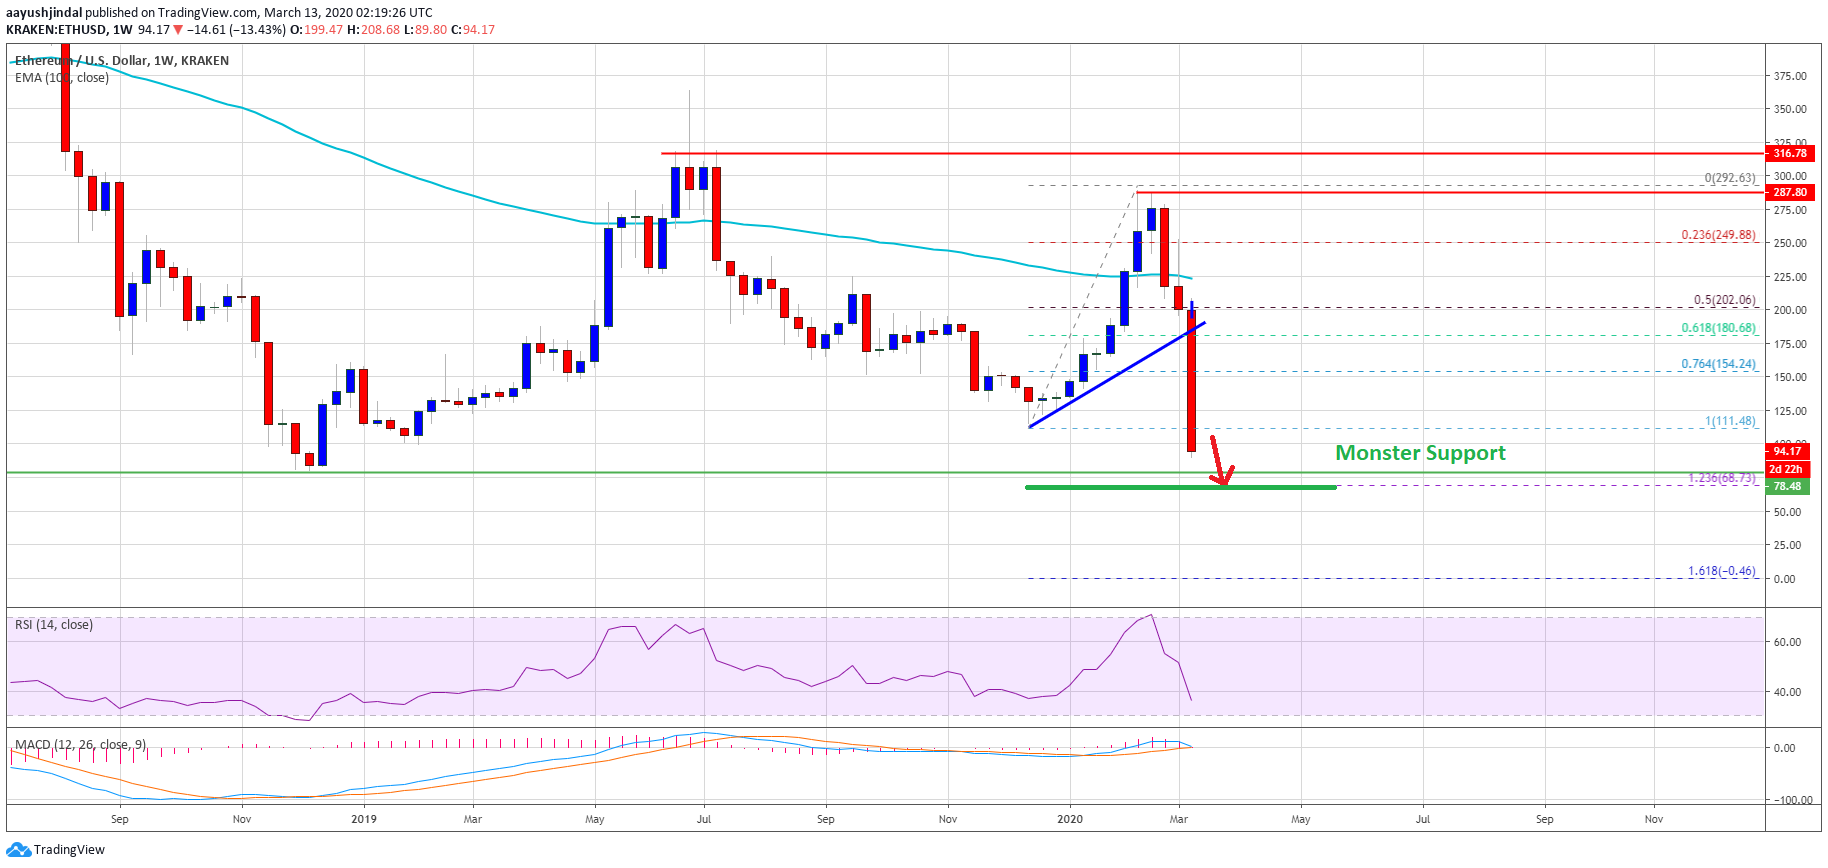
Ethereum is down more than 50% in a day against the US Dollar. ETH price broke many crucial supports and it is now approaching the $78 and $68 support levels.
- Ethereum collapsed below $150 and $100 in a harsh market crash against the US Dollar.
- The price is forming a huge bearish candle on the daily and weekly chart.
- There was a break below a major bullish trend line with support at $183 on the weekly chart of ETH/USD (data feed via Kraken).
- Bitcoin price is down more than 45% and it broke the key $5,000 support area.
Ethereum Price Could Dive Further
In the past three sessions, we saw a massive decline in Ethereum from well above the $195 level against the US Dollar. ETH price tumbled more than $100 and broke many important supports to start a strong downtrend.
The decline was such that there was a substantial-close below the $150 level and the 100-week simple moving average. Moreover, there was a break below a major bullish trend line with support at $183 on the weekly chart of ETH/USD.
Ethereum Price
Ethereum also failed to stay above the 76.4% Fib retracement level of the last major upward move from the $111 swing low to $292 high. It is now trading below the $100 support and it might continue to move down.
The mentioned $68 support holds a lot of importance since it is the 1.236 Fib extension level of the last major upward move from the $111 swing low to $292 high. Any further losses could decrease hopes of any crucial bounce in the coming months.
Long-Lasting Bearish Trend?
The recent collapse in Ethereum and bitcoin destroyed the market sentiment and the current bearish sentiment might last for a few months.
The market changed its course and in order to recover the bulls need to put up a strong fight. If they are able to protect the $78 and $68 support levels, there are chances of recovery. The last line of defense in the long term could be the $50 zone.
Technical Indicators
0 Commentaires